Market Outlook
December 23, 2016
Market Cues
Domestic Indices
Chg (%)
(Pts)
(Close)
Indian markets are expected to open flat tracking the SGX Nifty.
BSE Sensex
(1.0)
(263)
25,980
Nifty
(1.0)
(82)
7,979
US stock indices closed slightly lower on profit taking and low volumes. The
Commerce Department released a report showing a sharp of 4.6 percent in durable
Mid Cap
(1.5)
(176)
11,809
goods for the month of November against an expectation of a drop of about 4.4
Small Cap
(1.2)
(149)
11,802
percent. The Commerce Department said US GDP climbed 3.5 percent in the third
Bankex
(1.1)
(233)
20,459
quarter, reflecting an upward revision from the previously increase of 3.2 percent.
The NYSE Arca Steel Index closed down by 1.8 percent, while the Dow Jones Retail
Global Indices
Chg (%)
(Pts)
(Close)
Index fell by 1.6 percent.
Dow Jones
(0.1)
(23)
19,919
The FTSE 100 had a positive session in spite of news weakness on the part of mining
Nasdaq
(0.4)
(24)
5,447
stocks. The price of copper hit a one-month low after a report showed Chinese
metal imports had slowed sharply in November. BHP Billiton closed down 1.6%, Rio
FTSE
0.3
22
7,064
Tinto fell by 1% and Anglo American dropped 0.7%. However, Randgold Resources
Nikkei
(0.1)
(17)
19,428
increased 2.57 percent and Fresnillo gained 2.84 percent as gold prices climbed.
Hang Seng
(0.8)
(174)
21,636
Indian markets continued their fall for the seventh straight session. Investor sentiment
Shanghai Com
0.1
2
3,140
continued to remain negative due to concerns such as the impact of demonetisation,
the upcoming GST council as well as higher oil prices. All sectoral indices closed
Advances / Declines
BSE
NSE
down with the Metal and PSU bank indices being down the most. The Metal and
Advances
629
291
PSU bank indices lost 2.85 and 1.9 percent respectively.
Declines
2,057
1,329
News Analysis
Unchanged
135
56
Sun Pharma acquires cancer drug for $175 mln
Praj Industries to expand ethanol business
Volumes (` Cr)
Detailed analysis on Pg2
BSE
3,007
Investor’s Ready Reckoner
NSE
13,533
Key Domestic & Global Indicators
Net Inflows (` Cr)
Net
Mtd
Ytd
Stock Watch: Latest investment recommendations on 150+ stocks
Refer Pg5 onwards
FII
(1,108)
(2,810)
24,467
MFs
1,085
2,248
40,434
Top Picks
CMP
Target
Upside
Company
Sector
Rating
(`)
(`)
(%)
Top Gainers
Price (`)
Chg (%)
Amara Raja Batt. Auto & Auto Ancill.
Buy
868
1,167
34.4
Beml
962
4.1
Alkem Laboratories Pharmaceuticals
Buy
1,608
1,989
23.7
Bergepaint
202
3.5
HCL Tech
IT
Buy
818
1,000
22.3
Tubeinvest
571
2.1
Power Grid Corp. Power
Buy
182
223
22.6
Navkar Corp.
Others
Buy
164
265
61.8
Shriramcit
1,800
1.8
More Top Picks on Pg3
Gdl
226
1.6
Key Upcoming Events
Previous
Consensus
Top Losers
Price (`)
Chg (%)
Date
Region
Event Description
Reading
Expectations
Indianb
201
(5.6)
Dec 23 US
New home sales
563.0
575.0
Shreecem
13,422
(4.8)
Dec 23 UK
GDP (YoY)
2.3
2.3
Dec 27 US
Consumer Confidence
107.1
108.5
Nationalum
57
(4.5)
Jan 01 UK
PMI Manufacturing
53.4
53.3
Hindalco
161
(4.4)
Jan 02 China
PMI Manufacturing
51.7
51.6
Iifl
254
(4.4)
More Events on Pg4
As on December 22, 2016
Market Outlook
December 23, 2016
News Analysis
Sun Pharma acquires cancer drug for $175 mln
Sun Pharma has acquired skin cancer drug Odomzo from Novartis for $175mln
(around `1,172cr). The transaction gives Sun Pharma its first branded oncology
product. Odomzo (molecule name Sonidegib) has been approved for sale in 30
countries including those in Europe, US, and Australia. The global market for
cancer drugs is over $100bln and US is the single largest market.
Sun Pharma said an agreement has been signed for an upfront payment of
$175mln and additional milestone payments.
Odomzo was approved by the USFDA in July 2015. It is indicated for the treatment
of adult patients with locally advanced basal cell carcinoma.
Praj Industries to expand ethanol business
For Praj Industries Ltd recently signed a memorandum of understanding (MoU) for
2G ethanol plants. For the financial year 2015-2016, ethanol contributed 58% to
Praj's order intake. This share has now risen to 62% in the September 2016 ended
quarter. It is bound to increase with 2G ethanol plant orders. The management
had earlier guided to maintain 50:50 ratio between its ethanol and non-ethanol
business, but the business mix is now changing.
On December 7, Indian Oil Corporation Ltd and Praj Industries signed a binding
MoU for a cost sharing agreement to set up a 2G biomass ethanol plant at Dahej,
Gujarat and Panipat (Haryana). Similarly, Bharat Petroleum Corporation Ltd
(BPCL) and Praj signed a MoU for technology transfer for setting up of 2G biomass
ethanol bio-refinery at Bargarh, Odisha.
However, a lot of the company's 2G ethanol success hinges on the financing and
the execution of these orders. Praj's total expected investment in each of the
planned 2G ethanol plant is between `350 to `400cr.
Economic and Political News
GST Council to discuss issue of dual control today
Over 2 lakh farmers open mobile banking accounts and 81,000 are now
using e-wallet
Central Government formulating National Policy for Advanced Manufacturing
Corporate News
Parliamentary Standing Committee on Information Technology calls telecom
operators Airtel and Aircel to appear before it to on the issue of call drops
Tata Motors shareholders vote to remove Nusli Wadia as independent director
Suzlon and AMP Solar form Joint Venture for 15 MW project in Telangana
M&M Finance to raise `5,000cr via bonds
Market Outlook
December 23, 2016
Top Picks ★★★★★
Large Cap
Market Cap
CMP
Target
Upside
Company
Rationale
(` Cr)
(`)
(`)
(%)
To outpace battery industry growth due to better
Amara Raja Batteries
14,832
868
1,167
34.4
technological products leading to market share gains in
both the automotive OEM and replacement segments.
Strong growth in domestic business due to its leadership in
Alkem Laboratories
19,221
1,608
1,989
23.7
acute therapeutic segment. Alkem expects to launch more
products in USA, which bodes for its international business.
The stock is trading at attractive valuations and is factoring
HCL Tech
1,15,416
818
1,000
22.3
all the bad news.
Back on the growth trend; expect a long term growth of 14%
Infosys
2,26,295
985
1,249
26.7
to be a US$20bn in FY2020.
Strong order backlog and improvement in execution would
Larsen & Tourbo
1,22,778
1,316
1,634
24.1
trigger the growth for the L&T
One of the largest pharma companies with strong
international presence. It has a rich pipeline of ANDAs
Lupin
65,390
1,449
1,809
24.9
which is also one of the largest among the generic
companies.
Going forward, we expect the company to report strong
Power Grid Corporation
95,163
182
223
22.6
top-line CAGR of ~16% and bottom-line CAGR of ~19%
over FY16-18 on back of strong capitalization guidance
Source: Company, Angel Research
Mid Cap
Market Cap
CMP
Target
Upside
Company
Rationale
(` Cr)
(`)
(`)
(%)
We expect the company would report strong profitability
Asian Granito
662
220
351
59.5
owing to better product mix, higher B2C sales and
amalgamation synergy.
Among the top 4 players in the consumer durables segment.
Bajaj Electricals
2,176
215
274
27.2
Improved profitability backed by turn around in E&P
segment. Strong order book lends earnings visibility.
Favourable outlook for AC industry augurs well for Cooling
Blue Star
4,269
447
634
41.8
products business which is outgrowing the market. EMPPAC
division's is likely to turn around on improving economy
With a focus on the low and medium income (LMI)
Dewan Housing Finance
7,236
231
350
51.4
consumer segment, the company has increased its presence
in tier-II & III cities where the growth opportunity is immense.
Strong loan growth backed by diversified loan portfolio and
adequate CAR. ROE & ROA likely to remain decent as risk of
Equitas Holdings
4,861
145
235
62.1
dilution remains low. Attractive valuations considering
growth.
Economic recovery to have favourable impact on advertising
& circulation revenue growth. Further, the acquisition of a
Jagran Prakashan
5,495
168
225
33.8
radio business (Radio City) would also boost the company's
revenue growth.
Speedier execution and speedier sales, strong revenue
Mahindra Lifespace
1,424
347
522
50.4
visibilty in short-to-long run, attractive valuations
We expect the company to report strong growth on back of
healthy growth in domestic branded sales (owing to
Mirza International
1,005
84
107
28.1
aggressive ad spend and addition in the number of EBOs &
multi-brand outlets [MBOs]) and healthy export revenues.
Massive capacity expansion along with rail advantage at
Navkar Corporation
2,336
164
265
61.8
ICD as well CFS augurs well for the company.
Strong brands and distribution network would boost growth
Siyaram Silk Mills
1,113
1,188
1,605
35.1
going ahead. Stock currently trades at an inexpensive
valuation.
Market leadership in Hindi news genre and no. 2 viewership
ranking in English news genre, exit from the radio business,
TV Today Network
1,541
258
385
49.1
and anticipated growth in ad spends by corporate to benefit
the stock.
Source: Company, Angel Research
Market Outlook
December 23, 2016
Key Upcoming Events
Global economic events release calendar
Date
Time
Country
Event Description
Unit
Period
Bloomberg Data
Last Reported Estimated
Dec 23, 2016
8:30PM
US
New home sales
Thousands
Nov
563.00
575.00
3:00PM
UK
GDP (YoY)
% Change
3Q F
2.30
2.30
Dec 27, 2016
8:30PM
US
Consumer Confidence
S.A./ 1985=100
Dec
107.10
108.50
Jan 1, 2017
3:00PM
UK
PMI Manufacturing
Value
Dec
53.40
53.30
Jan 2, 2017
6:30AM
China
PMI Manufacturing
Value
Dec
51.70
51.60
Jan 3, 2017
2:25PM
Germany
PMI Manufacturing
Value
Dec F
55.50
55.50
2:25PM
Germany
Unemployment change (000's)
Thousands
Dec
(5.00)
(4.00)
Jan 4, 2017
2:25PM
Germany
PMI Services
Value
Dec F
53.80
53.80
Jan 6, 2017
3:30PM
Euro Zone
Euro-Zone Consumer Confidence
Value
Dec F
(5.10)
(6.00)
7:00PM
US
Change in Nonfarm payrolls
Thousands
Dec
178.00
175.00
7:00PM
US
Unnemployment rate
%
Dec
4.60
4.70
Jan 8, 2017
China
Exports YoY%
% Change
Dec
(1.60)
--
Jan 9, 2017
China
Consumer Price Index (YoY)
% Change
Dec
2.30
--
Jan 10, 2017
India
Imports YoY%
% Change
Dec
10.40
--
India
Exports YoY%
% Change
Dec
2.30
--
Jan 11, 2017
5:30PM
India
Industrial Production YoY
% Change
Nov
(1.90)
--
Jan 12, 2017
3:00PM
UK
Industrial Production (YoY)
% Change
Nov
(1.10)
--
Jan 13, 2017
US
Producer Price Index (mom)
% Change
Dec
--
--
Jan 16, 2017
12:00PM
India
Monthly Wholesale Prices YoY%
% Change
Dec
3.15
--
Jan 17, 2017
3:00PM
UK
CPI (YoY)
% Change
Dec
1.20
--
China
Industrial Production (YoY)
% Change
Dec
6.20
--
China
Real GDP (YoY)
% Change
4Q
6.70
--
Jan 18, 2017
7:00PM
US
Consumer price index (mom)
% Change
Dec
0.20
--
3:30PM
Euro Zone
Euro-Zone CPI (YoY)
%
Dec F
0.60
--
3:00PM
UK
Jobless claims change
% Change
Dec
2.40
--
7:00PM
US
Housing Starts
Thousands
Dec
1,090.00
--
Source: Bloomberg, Angel Research
Market Outlook
December 23, 2016
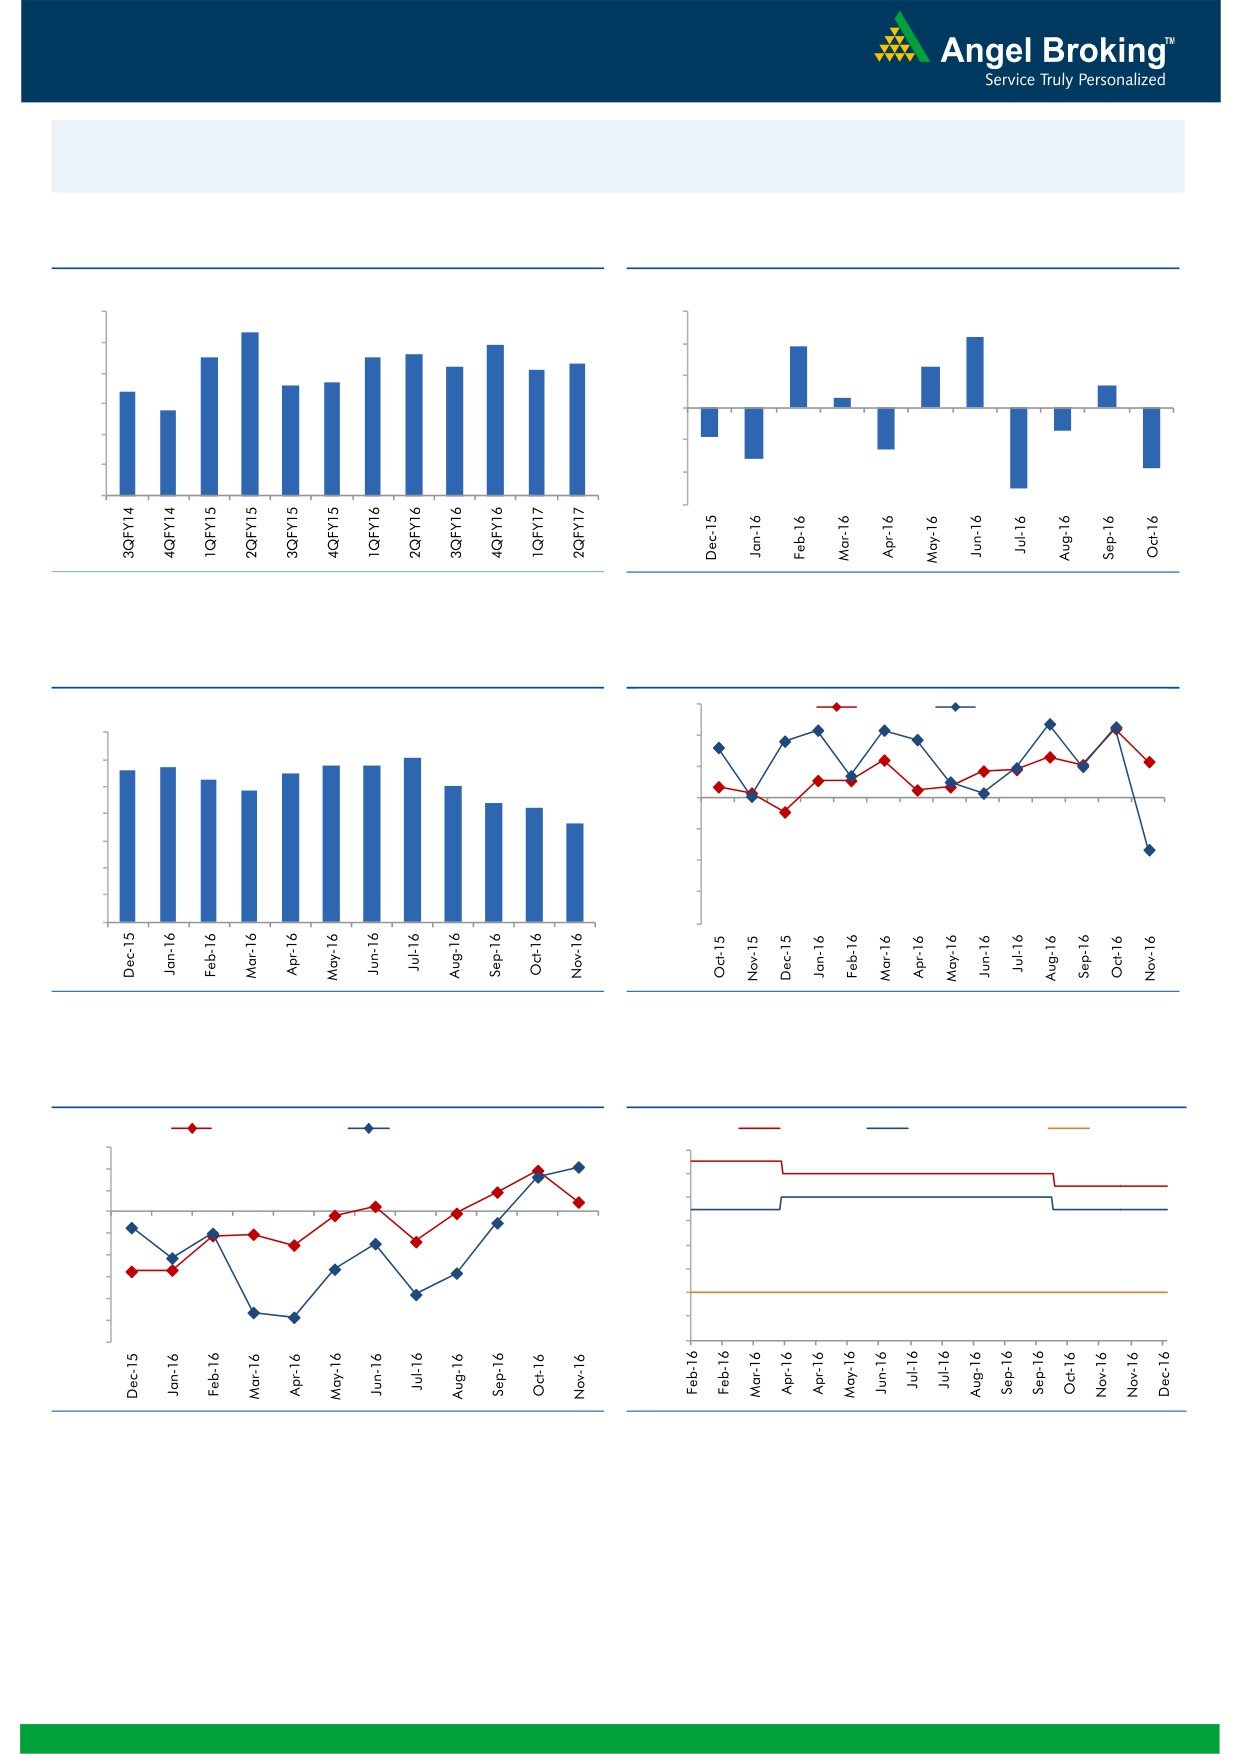
Macro watch
Exhibit 1: Quarterly GDP trends
Exhibit 2: IIP trends
(%)
(%)
9.0
3.0
8.3
2.2
7.9
1.9
7.5
7.5
7.6
8.0
7.3
2.0
7.2
7.1
1.3
6.6
6.7
0.7
7.0
6.4
1.0
0.3
5.8
6.0
-
5.0
(1.0)
(0.7)
(0.9)
4.0
(1.3)
(2.0)
(1.6)
(1.9)
3.0
(3.0)
(2.5)
Source: CSO, Angel Research
Source: MOSPI, Angel Research
Exhibit 3: Monthly CPI inflation trends
Exhibit 4: Manufacturing and services PMI
56.0
Mfg. PMI
Services PMI
(%)
7.0
54.0
6.1
5.6
5.7
5.8
5.8
6.0
5.3
5.5
5.1
52.0
4.8
5.0
4.4
4.2
50.0
3.6
4.0
48.0
3.0
46.0
2.0
1.0
44.0
-
42.0
Source: MOSPI, Angel Research
Source: Market, Angel Research; Note: Level above 50 indicates expansion
Exhibit 5: Exports and imports growth trends
Exhibit 6: Key policy rates
(%)
Exports yoy growth
Imports yoy growth
(%)
Repo rate
Reverse Repo rate
CRR
15.0
7.00
10.0
6.50
5.0
6.00
0.0
5.50
(5.0)
5.00
(10.0)
4.50
(15.0)
(20.0)
4.00
(25.0)
3.50
(30.0)
3.00
Source: Bloomberg, Angel Research
Source: RBI, Angel Research
Market Outlook
December 23, 2016
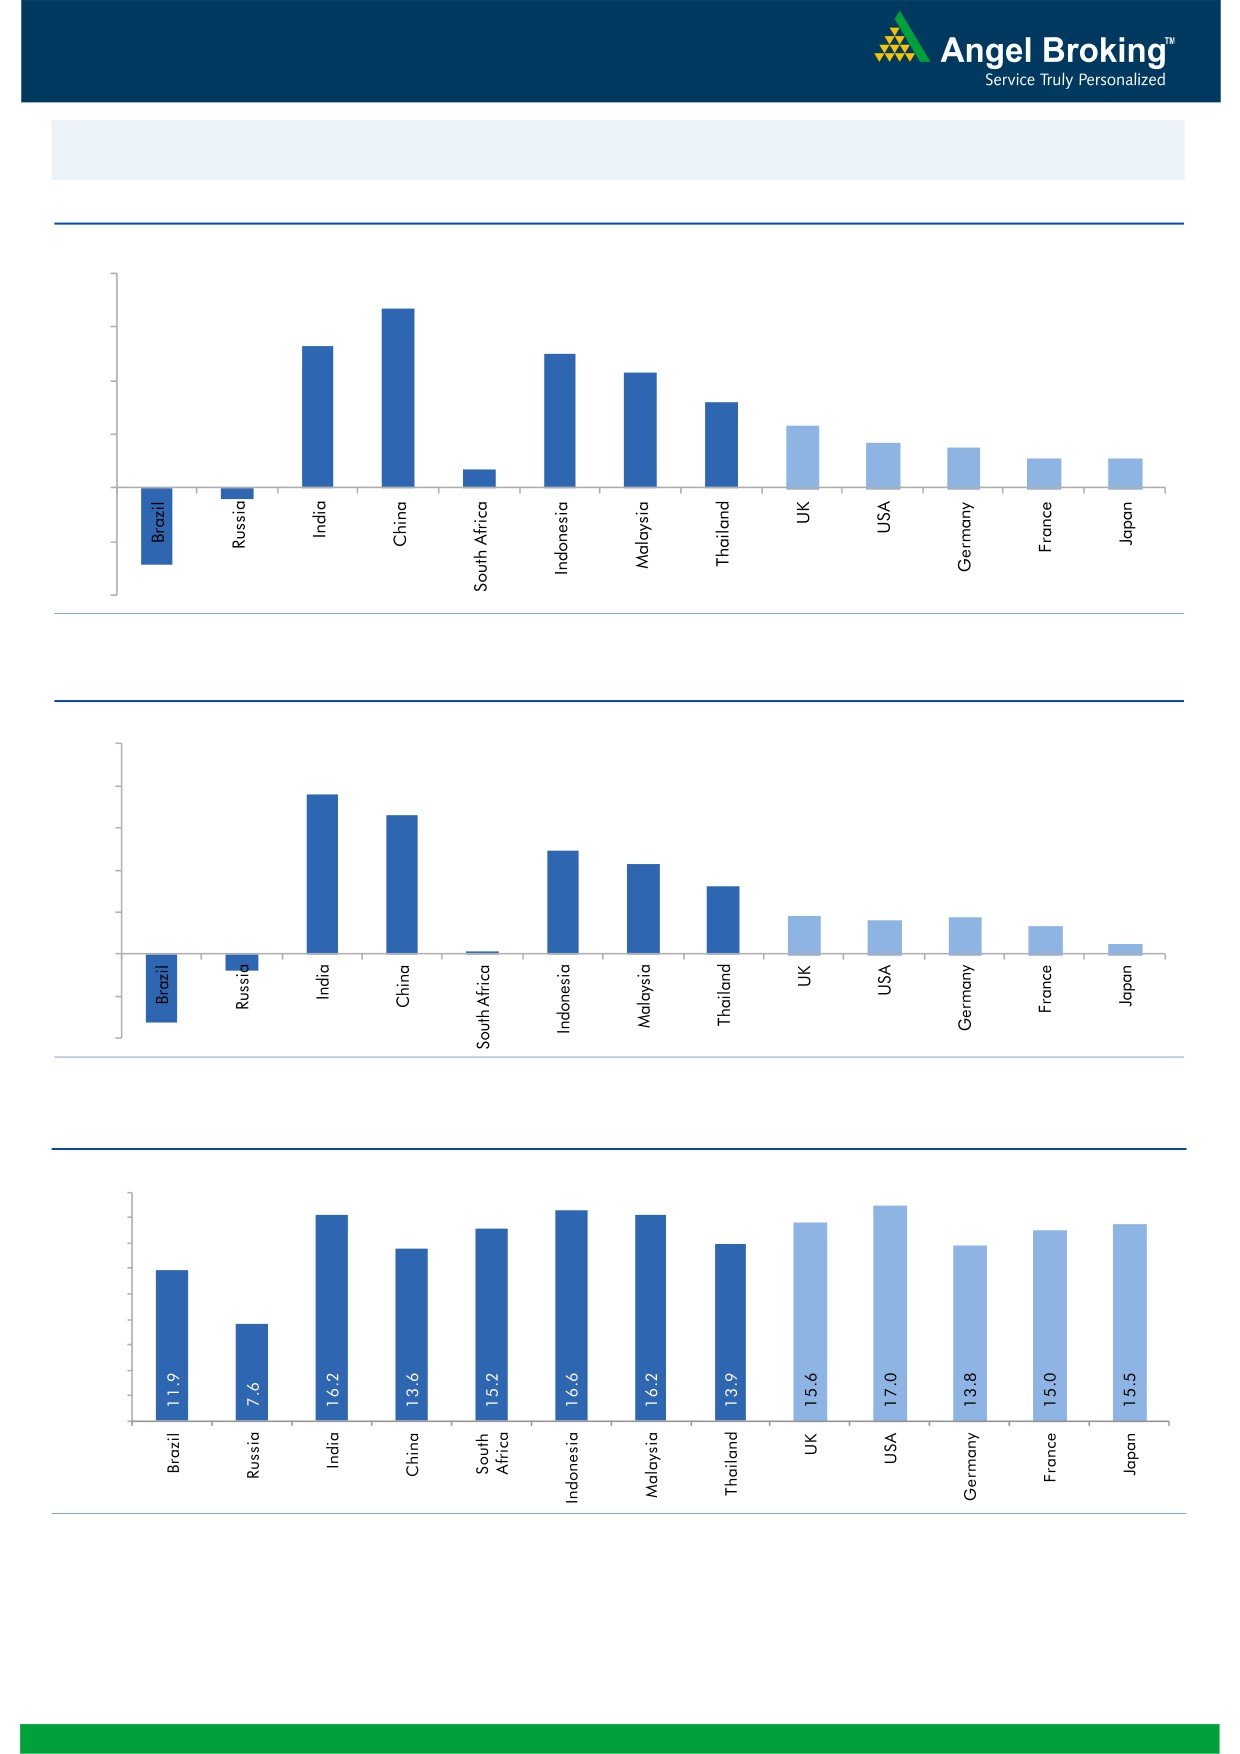
Global watch
Exhibit 1: Latest quarterly GDP Growth (%, yoy) across select developing and developed countries
(%)
8.0
6.7
5.3
6.0
5.0
0.7
4.3
4.0
3.2
2.3
1.7
1.5
2.0
1.1
1.1
-
(2.0)
(0.4)
(2.9)
(4.0)
Source: Bloomberg, Angel Research
Exhibit 2: 2016 GDP Growth projection by IMF (%, yoy) across select developing and developed countries
(%)
10.0
7.6
8.0
6.6
6.0
4.9
4.3
4.0
3.2
1.8
1.7
1.6
1.3
2.0
(0.8)
0.5
(3.3)
0.1
-
(2.0)
(4.0)
Source: IMF, Angel Research
Exhibit 3: One year forward P-E ratio across select developing and developed countries
(x)
18.0
16.0
14.0
12.0
10.0
8.0
6.0
4.0
2.0
-
Source: IMF, Angel Research
Market Outlook
December 23, 2016
Exhibit 4: Relative performance of indices across globe
Returns (%)
Country
Name of index
Closing price
1M
3M
1YR
Brazil
Bovespa
57,255
(7.6)
(0.8)
26.5
Russia
Micex
2,175
5.2
7.4
26.2
India
Nifty
7,979
(0.3)
(9.1)
2.9
China
Shanghai Composite
3,140
(3.4)
3.5
(10.8)
South Africa
Top 40
43,284
(2.0)
(4.5)
(3.6)
Mexico
Mexbol
45,008
1.5
(2.9)
3.3
Indonesia
LQ45
833
(3.3)
(10.4)
11.4
Malaysia
KLCI
1,623
(0.3)
(2.1)
0.0
Thailand
SET 50
939
2.3
(0.0)
14.6
USA
Dow Jones
19,919
5.1
8.3
13.5
UK
FTSE
7,064
3.6
2.2
11.9
Japan
Nikkei
19,428
7.3
17.6
2.9
Germany
DAX
11,456
6.9
7.3
5.5
France
CAC
4,835
6.3
7.7
6.9
Source: Bloomberg, Angel Research
Stock Watch
December 23, 2016
Company Name
Reco
CMP
Target
Mkt Cap
Sales ( Čcr )
OPM(%)
EPS (Č)
PER(x)
P/BV(x)
RoE(%)
EV/Sales(x)
(Č)
Price ( Č)
( Č cr )
FY17E FY18E
FY17E
FY18E
FY17E
FY18E
FY17E
FY18E
FY17E
FY18E
FY17E
FY18E
FY17E
FY18E
Agri / Agri Chemical
Rallis
Accumulate
195
209
3,783
1,937
2,164
13.3
14.3
9.0
11.0
21.6
17.7
3.8
3.3
18.4
19.8
2.0
1.7
United Phosphorus
Accumulate
619
684
31,401
15,176
17,604
18.5
18.5
37.4
44.6
16.6
13.9
3.3
2.7
21.4
21.2
2.2
1.8
Auto & Auto Ancillary
Ashok Leyland
Buy
78
111
22,056
22,407
26,022
10.6
10.6
5.2
6.4
14.9
12.1
3.4
2.8
23.6
24.7
1.1
0.9
Bajaj Auto
Neutral
2,567
-
74,267
25,093
27,891
19.5
19.2
143.9
162.5
17.8
15.8
5.0
4.3
30.3
29.4
2.7
2.3
Bharat Forge
Neutral
913
-
21,245
7,726
8,713
20.5
21.2
35.3
42.7
25.9
21.4
4.8
4.3
18.9
20.1
2.8
2.4
Eicher Motors
Neutral
21,305
-
57,958
16,583
20,447
17.5
18.0
598.0
745.2
35.6
28.6
12.2
9.3
41.2
38.3
3.3
2.6
Gabriel India
Buy
108
130
1,557
1,544
1,715
9.0
9.3
5.4
6.3
20.1
17.2
3.8
3.4
18.9
19.5
1.0
0.9
Hero Motocorp
Buy
3,001
3,541
59,917
30,958
34,139
15.7
15.7
193.6
208.3
15.5
14.4
6.1
5.0
34.2
30.5
1.8
1.6
Jamna Auto Industries Neutral
155
-
1,236
1,486
1,620
9.8
9.9
15.0
17.2
10.4
9.0
2.3
1.9
21.8
21.3
0.9
0.8
L G Balakrishnan & Bros Neutral
556
-
872
1,302
1,432
11.6
11.9
43.7
53.0
12.7
10.5
1.8
1.6
13.8
14.2
0.8
0.7
Mahindra and Mahindra Neutral
1,183
-
73,485
46,534
53,077
11.6
11.7
67.3
78.1
17.6
15.2
2.9
2.5
15.4
15.8
1.6
1.3
Maruti
Buy
5,084
6,006
153,585
68,057
82,958
15.8
15.5
212.1
261.2
24.0
19.5
4.8
4.0
19.8
20.3
1.9
1.5
Minda Industries
Neutral
302
-
2,392
2,728
3,042
9.0
9.1
68.2
86.2
4.4
3.5
1.0
0.8
23.8
24.3
0.9
0.8
Motherson Sumi
Neutral
319
-
44,789
45,896
53,687
7.8
8.3
13.0
16.1
24.5
19.8
7.9
6.3
34.7
35.4
1.0
0.9
Rane Brake Lining
Neutral
920
-
728
511
562
11.3
11.5
28.1
30.9
32.8
29.8
5.0
4.5
15.3
15.0
1.6
1.4
Setco Automotive
Neutral
37
-
490
741
837
13.0
13.0
15.2
17.0
2.4
2.2
0.4
0.4
15.8
16.3
1.0
1.0
Tata Motors
Neutral
470
-
135,598
300,209
338,549
8.9
8.4
42.7
54.3
11.0
8.7
1.8
1.5
15.6
17.2
0.6
0.5
TVS Motor
Neutral
367
-
17,429
13,390
15,948
6.9
7.1
12.8
16.5
28.8
22.2
7.2
5.7
26.3
27.2
1.3
1.1
Amara Raja Batteries
Buy
868
1,167
14,832
5,504
6,605
17.6
17.5
33.4
40.9
26.0
21.2
5.7
4.7
22.1
22.0
2.7
2.2
Exide Industries
Neutral
171
-
14,573
7,439
8,307
15.0
15.0
8.1
9.3
21.2
18.4
3.0
2.7
14.3
16.7
1.6
1.4
Apollo Tyres
Buy
190
235
9,654
12,877
14,504
14.3
13.9
21.4
23.0
8.9
8.3
1.4
1.2
16.4
15.2
0.9
0.9
Ceat
Buy
1,130
1,450
4,570
7,524
8,624
13.0
12.7
131.1
144.3
8.6
7.8
1.6
1.3
19.8
18.6
0.7
0.6
JK Tyres
Neutral
111
-
2,510
7,455
8,056
15.0
15.0
21.8
24.5
5.1
4.5
1.1
0.9
22.8
21.3
0.5
0.4
Swaraj Engines
Neutral
1,350
-
1,677
660
810
15.2
16.4
54.5
72.8
24.8
18.5
7.7
7.0
31.5
39.2
2.4
1.9
Subros
Neutral
151
-
905
1,488
1,681
11.7
11.9
6.4
7.2
23.6
21.1
2.5
2.3
10.8
11.4
0.8
0.7
Indag Rubber
Neutral
178
-
466
286
326
19.8
16.8
11.7
13.3
15.2
13.3
2.6
2.4
17.8
17.1
1.3
1.1
Capital Goods
ACE
Neutral
45
-
445
709
814
4.1
4.6
1.4
2.1
32.1
21.4
1.3
1.3
4.4
6.0
0.8
0.7
BEML
Neutral
962
-
4,007
3,451
4,055
6.3
9.2
31.4
57.9
30.7
16.6
1.8
1.7
6.3
10.9
1.3
1.1
Bharat Electronics
Neutral
1,394
-
31,142
8,137
9,169
16.8
17.2
58.7
62.5
23.8
22.3
3.7
3.3
44.6
46.3
2.8
2.5
Stock Watch
December 23, 2016
Company Name
Reco
CMP
Target
Mkt Cap
Sales ( Čcr )
OPM(%)
EPS (Č)
PER(x)
P/BV(x)
RoE(%)
EV/Sales(x)
(Č)
Price ( Č)
( Č cr )
FY17E
FY18E
FY17E
FY18E
FY17E
FY18E
FY17E
FY18E
FY17E
FY18E
FY17E
FY18E
FY17E
FY18E
Capital Goods
Voltas
Buy
311
407
10,279
6,511
7,514
7.9
8.7
12.9
16.3
24.1
19.1
4.3
3.8
16.7
18.5
1.3
1.1
BGR Energy
Neutral
112
-
805
16,567
33,848
6.0
5.6
7.8
5.9
14.3
18.9
0.8
0.8
4.7
4.2
0.2
0.1
BHEL
Neutral
119
-
29,139
28,797
34,742
-
2.8
2.3
6.9
51.8
17.3
0.9
0.9
1.3
4.8
0.7
0.4
Blue Star
Buy
447
634
4,269
4,283
5,077
5.9
7.3
14.9
22.1
30.0
20.2
5.8
4.9
20.4
26.4
1.0
0.9
Crompton Greaves
Neutral
57
-
3,588
5,777
6,120
5.9
7.0
3.3
4.5
17.4
12.7
0.8
0.7
4.4
5.9
0.6
0.5
Greaves Cotton
Neutral
120
-
2,928
1,755
1,881
16.8
16.9
7.8
8.5
15.4
14.1
3.1
2.9
20.6
20.9
1.4
1.2
Inox Wind
Neutral
186
-
4,125
5,605
6,267
15.7
16.4
24.8
30.0
7.5
6.2
2.1
1.5
25.9
24.4
0.8
0.6
KEC International
Neutral
135
-
3,467
9,294
10,186
7.9
8.1
9.9
11.9
13.6
11.3
2.0
1.7
15.6
16.3
0.6
0.5
Thermax
Neutral
777
-
9,255
5,421
5,940
7.3
7.3
25.7
30.2
30.2
25.7
3.7
3.3
12.2
13.1
1.6
1.5
VATech Wabag
Buy
452
681
2,464
3,136
3,845
8.9
9.1
26.0
35.9
17.4
12.6
2.2
1.9
13.4
15.9
0.7
0.5
Cement
ACC
Neutral
1,289
-
24,213
11,225
13,172
13.2
16.9
44.5
75.5
29.0
17.1
2.7
2.5
11.2
14.2
2.2
1.8
Ambuja Cements
Neutral
200
-
39,772
9,350
10,979
18.2
22.5
5.8
9.5
34.5
21.1
2.9
2.6
10.2
12.5
4.3
3.6
India Cements
Neutral
112
-
3,428
4,364
4,997
18.5
19.2
7.9
11.3
14.1
9.9
1.0
1.0
8.0
8.5
1.5
1.4
JK Cement
Neutral
655
-
4,578
4,398
5,173
15.5
17.5
31.2
55.5
21.0
11.8
2.5
2.2
12.0
15.5
1.6
1.3
J K Lakshmi Cement
Buy
334
565
3,933
2,913
3,412
14.5
19.5
7.5
22.5
44.6
14.9
2.7
2.3
12.5
18.0
1.9
1.6
Orient Cement
Buy
118
215
2,417
2,114
2,558
18.5
20.5
8.1
11.3
14.6
10.4
2.2
1.8
9.0
14.0
1.8
1.4
UltraTech Cement
Neutral
3,152
-
86,523
25,768
30,385
21.0
23.5
111.0
160.0
28.4
19.7
3.6
3.2
13.5
15.8
3.5
2.9
Construction
ITNL
Neutral
101
-
3,326
8,946
10,017
31.0
31.6
8.1
9.1
12.5
11.1
0.5
0.5
4.2
5.0
3.7
3.4
KNR Constructions
Buy
161
802
2,265
1,385
1,673
14.7
14.0
41.2
48.5
3.9
3.3
0.7
0.6
14.9
15.2
1.7
1.4
Larsen & Toubro
Buy
1,316
1,634
122,778
111,017
124,908
11.0
11.0
61.1
66.7
21.6
19.7
2.6
2.4
13.1
12.9
2.1
2.0
Gujarat Pipavav Port
Neutral
131
-
6,309
705
788
52.2
51.7
5.0
5.6
26.1
23.3
2.6
2.3
11.2
11.2
8.6
7.2
Nagarjuna Const.
Neutral
79
-
4,384
8,842
9,775
9.1
8.8
5.3
6.4
14.9
12.3
1.2
1.1
8.2
9.1
0.7
0.6
PNC Infratech
Buy
104
143
2,655
2,350
2,904
13.1
13.2
9.0
8.8
11.5
11.8
0.4
0.4
15.9
13.9
1.2
1.0
Simplex Infra
Neutral
279
-
1,378
6,829
7,954
10.5
10.5
31.4
37.4
8.9
7.5
0.9
0.8
9.9
13.4
0.6
0.5
Power Mech Projects
Neutral
445
-
654
1,801
2,219
12.7
14.6
72.1
113.9
6.2
3.9
1.1
1.0
16.8
11.9
0.4
0.3
Sadbhav Engineering
Accumulate
261
298
4,468
3,598
4,140
10.3
10.6
9.0
11.9
28.9
21.9
3.0
2.7
9.9
11.9
1.5
1.3
NBCC
Neutral
223
-
13,377
7,428
9,549
7.9
8.6
8.2
11.0
27.2
20.3
1.4
1.1
28.2
28.7
1.5
1.1
MEP Infra
Neutral
36
-
585
1,877
1,943
30.6
29.8
3.0
4.2
12.0
8.6
5.8
3.9
0.6
0.6
1.7
1.5
SIPL
Neutral
94
-
3,309
1,036
1,252
65.5
66.2
(8.4)
(5.6)
3.5
4.0
(22.8)
(15.9)
11.4
9.5
Stock Watch
December 23, 2016
Company Name
Reco
CMP
Target
Mkt Cap
Sales ( Čcr )
OPM(%)
EPS (Č)
PER(x)
P/BV(x)
RoE(%)
EV/Sales(x)
(Č)
Price ( Č)
( Č cr )
FY17E
FY18E
FY17E
FY18E
FY17E
FY18E
FY17E
FY18E
FY17E
FY18E
FY17E
FY18E
FY17E
FY18E
Construction
Engineers India
Neutral
316
-
10,661
1,725
1,935
16.0
19.1
11.4
13.9
27.8
22.8
3.8
3.7
13.4
15.3
5.1
4.6
Financials
Axis Bank
Buy
448
630
107,232
46,932
53,575
3.5
3.4
32.4
44.6
13.9
10.1
1.8
1.6
13.6
16.5
-
-
Bank of Baroda
Neutral
155
-
35,738
19,980
23,178
1.8
1.8
11.5
17.3
13.5
9.0
1.5
1.3
8.3
10.1
-
-
Canara Bank
Neutral
283
-
15,369
15,225
16,836
1.8
1.8
14.5
28.0
19.5
10.1
1.4
1.1
5.8
8.5
-
-
Dewan Housing Finance Buy
231
350
7,236
2,225
2,688
2.9
2.9
29.7
34.6
7.8
6.7
1.3
1.1
16.1
16.8
-
-
Equitas Holdings
Buy
145
235
4,861
939
1,281
11.7
11.5
5.8
8.2
25.0
17.7
2.2
1.9
10.9
11.5
-
-
Federal Bank
Neutral
66
-
11,330
9,353
10,623
2.9
2.9
4.4
5.8
15.0
11.4
1.4
1.3
9.5
11.0
-
-
HDFC
Neutral
1,219
-
192,871
11,475
13,450
3.4
3.4
45.3
52.5
26.9
23.2
5.2
4.6
20.2
20.5
-
-
HDFC Bank
Buy
1,173
1,350
299,339
46,097
55,433
4.5
4.5
58.4
68.0
20.1
17.2
3.5
2.9
18.8
18.6
-
-
ICICI Bank
Buy
253
315
147,248
42,800
44,686
3.1
3.3
18.0
21.9
14.1
11.6
1.9
1.8
11.1
12.3
-
-
Lakshmi Vilas Bank
Buy
142
174
2,556
3,339
3,799
2.7
2.8
11.0
14.0
13.0
10.2
1.3
1.2
11.2
12.7
-
-
LIC Housing Finance
Buy
540
630
27,229
3,712
4,293
2.6
2.5
39.0
46.0
13.8
11.7
2.6
2.2
19.9
20.1
-
-
Punjab Natl.Bank
Neutral
119
-
25,397
23,532
23,595
2.3
2.4
6.8
12.6
17.6
9.5
2.7
1.9
3.3
6.5
-
-
RBL Bank
Neutral
340
-
12,581
1,783
2,309
2.6
2.6
12.7
16.4
26.8
20.7
2.9
2.6
12.8
13.3
-
-
South Ind.Bank
Neutral
21
-
2,771
6,435
7,578
2.5
2.5
2.7
3.1
7.6
6.6
1.0
0.8
10.1
11.2
-
-
St Bk of India
Neutral
250
-
193,875
88,650
98,335
2.6
2.6
13.5
18.8
18.5
13.3
1.8
1.5
7.0
8.5
-
-
Union Bank
Neutral
126
-
8,689
13,450
14,925
2.3
2.3
25.5
34.5
5.0
3.7
0.7
0.6
7.5
10.2
-
-
Yes Bank
Neutral
1,127
-
47,637
8,978
11,281
3.3
3.4
74.0
90.0
15.2
12.5
2.9
2.5
17.0
17.2
-
-
FMCG
Asian Paints
Neutral
870
-
83,407
17,128
18,978
16.8
16.4
19.1
20.7
45.5
42.0
15.8
14.9
34.8
35.5
4.8
4.3
Britannia
Buy
2,811
3,626
33,730
9,594
11,011
14.6
14.9
80.3
94.0
35.0
29.9
14.4
11.1
41.2
-
3.4
2.9
Colgate
Accumulate
904
995
24,586
4,605
5,149
23.4
23.4
23.8
26.9
38.0
33.6
21.0
16.4
64.8
66.8
5.3
4.7
Dabur India
Accumulate
266
304
46,804
8,315
9,405
19.8
20.7
8.1
9.2
32.8
28.9
9.1
7.6
31.6
31.0
5.3
4.6
GlaxoSmith Con*
Neutral
4,966
-
20,883
4,350
4,823
21.2
21.4
179.2
196.5
27.7
25.3
7.4
6.2
27.1
26.8
4.2
3.7
Godrej Consumer
Neutral
1,437
-
48,958
10,235
11,428
18.4
18.6
41.1
44.2
35.0
32.5
7.8
6.6
24.9
24.8
4.9
4.3
HUL
Neutral
789
-
170,783
35,252
38,495
17.8
17.8
20.7
22.4
38.2
35.3
36.5
31.3
95.6
88.9
4.7
4.3
ITC
Buy
227
284
275,413
40,059
44,439
38.3
39.2
9.0
10.1
25.3
22.4
7.1
6.2
27.8
27.5
6.4
5.7
Marico
Buy
249
300
32,121
6,430
7,349
18.8
19.5
6.4
7.7
38.9
32.3
11.7
9.9
33.2
32.5
4.8
4.2
Nestle*
Neutral
5,772
-
55,649
10,073
11,807
20.7
21.5
124.8
154.2
46.3
37.4
19.0
17.1
34.8
36.7
5.3
4.5
Tata Global
Neutral
119
-
7,536
8,675
9,088
9.8
9.8
7.4
8.2
16.1
14.6
1.8
1.8
7.9
8.1
0.8
0.7
Stock Watch
December 23, 2016
Company Name
Reco
CMP
Target
Mkt Cap
Sales ( Čcr )
OPM(%)
EPS (Č)
PER(x)
P/BV(x)
RoE(%)
EV/Sales(x)
(Č)
Price ( Č)
( Č cr )
FY17E FY18E
FY17E
FY18E
FY17E
FY18E
FY17E
FY18E
FY17E
FY18E
FY17E
FY18E
FY17E
FY18E
FMCG
Procter & Gamble
Accumulate
6,660
7,369
21,619
2,939
3,342
23.2
23.0
146.2
163.7
45.6
40.7
102.0
97.8
25.3
23.5
6.9
6.0
Hygiene
IT
HCL Tech^
Buy
818
1,000
115,416
49,242
57,168
20.5
20.5
55.7
64.1
14.7
12.8
3.0
2.3
20.3
17.9
2.2
1.8
Infosys
Buy
985
1,249
226,295
68,350
77,326
27.0
27.0
62.5
69.4
15.8
14.2
3.4
3.1
21.3
21.6
2.8
2.4
TCS
Accumulate
2,310
2,620
455,139
119,025
133,308
27.6
27.6
131.2
145.5
17.6
15.9
5.7
5.3
32.4
33.1
3.6
3.2
Tech Mahindra
Buy
474
600
46,128
29,673
32,937
15.5
17.0
32.8
39.9
14.5
11.9
2.8
2.5
19.6
20.7
1.3
1.1
Wipro
Buy
461
590
112,148
55,440
60,430
18.1
18.1
35.9
39.9
12.9
11.6
2.3
2.1
19.0
19.3
1.7
1.6
Media
D B Corp
Neutral
348
-
6,402
2,297
2,590
27.4
28.2
21.0
23.4
16.6
14.9
3.9
3.4
23.7
23.1
2.6
2.2
HT Media
Neutral
74
-
1,722
2,693
2,991
12.6
12.9
7.9
9.0
9.4
8.2
0.8
0.7
7.8
8.3
0.2
0.1
Jagran Prakashan
Buy
168
225
5,495
2,355
2,635
28.0
28.0
10.8
12.5
15.6
13.5
3.4
2.9
21.7
21.7
2.4
2.1
Sun TV Network
Neutral
488
-
19,241
2,850
3,265
70.1
71.0
26.2
30.4
18.6
16.1
4.8
4.2
24.3
25.6
6.3
5.4
Hindustan Media
Neutral
269
-
1,977
1,016
1,138
24.3
25.2
27.3
30.1
9.9
9.0
1.9
1.7
16.2
15.8
1.3
1.1
Ventures
TV Today Network
Buy
258
385
1,541
637
743
27.5
27.5
18.4
21.4
14.1
12.1
2.5
2.1
17.4
17.2
2.0
1.6
Metals & Mining
Coal India
Neutral
288
-
178,866
84,638
94,297
21.4
22.3
24.5
27.1
11.8
10.6
4.9
4.7
42.6
46.0
1.6
1.5
Hind. Zinc
Neutral
261
-
110,260
14,252
18,465
55.9
48.3
15.8
21.5
16.5
12.1
2.7
2.4
17.0
20.7
7.7
6.0
Hindalco
Neutral
161
-
33,345
107,899
112,095
7.4
8.2
9.2
13.0
17.5
12.4
0.8
0.8
4.8
6.6
0.8
0.8
JSW Steel
Neutral
1,569
-
37,920
53,201
58,779
16.1
16.2
130.6
153.7
12.0
10.2
1.6
1.4
14.0
14.4
1.5
1.3
NMDC
Neutral
123
-
39,011
6,643
7,284
44.4
47.7
7.1
7.7
17.4
16.0
1.5
1.5
8.8
9.2
3.6
3.3
SAIL
Neutral
50
-
20,547
47,528
53,738
(0.7)
2.1
(1.9)
2.6
19.1
0.5
0.5
(1.6)
3.9
1.3
1.2
Vedanta
Neutral
217
-
64,230
71,744
81,944
19.2
21.7
13.4
20.1
16.2
10.8
1.4
1.2
8.4
11.3
1.3
1.0
Tata Steel
Neutral
392
-
38,110
121,374
121,856
7.2
8.4
18.6
34.3
21.1
11.4
1.3
1.2
6.1
10.1
1.0
0.9
Oil & Gas
Cairn India
Neutral
243
-
45,621
9,127
10,632
4.3
20.6
8.8
11.7
27.6
20.8
0.9
0.9
3.3
4.2
6.5
5.4
GAIL
Neutral
425
-
53,898
56,220
65,198
9.3
10.1
27.1
33.3
15.7
12.8
1.4
1.3
9.3
10.7
1.1
1.0
ONGC
Neutral
195
-
250,697
137,222
152,563
15.0
21.8
19.5
24.1
10.0
8.1
0.9
0.8
8.5
10.1
2.1
1.9
Indian Oil Corp
Neutral
306
-
148,736
373,359
428,656
5.9
5.5
54.0
59.3
5.7
5.2
0.9
0.8
16.0
15.6
0.6
0.5
Reliance Industries
Neutral
1,054
-
341,858
301,963
358,039
12.1
12.6
87.7
101.7
12.0
10.4
1.2
1.1
10.7
11.3
1.6
1.3
Pharmaceuticals
Alembic Pharma
Neutral
620
-
11,687
3,483
4,083
20.2
21.4
24.3
30.4
25.5
20.4
5.8
4.6
25.5
25.3
3.3
2.7
Alkem Laboratories Ltd
Buy
1,608
1,989
19,221
6,043
6,893
18.7
19.3
80.5
88.8
20.0
18.1
4.5
3.7
22.3
20.3
3.1
2.7
Aurobindo Pharma
Buy
658
877
38,522
15,720
18,078
23.7
23.7
41.4
47.3
15.9
13.9
4.1
3.2
29.6
26.1
2.7
2.3
Sanofi India*
Neutral
4,254
-
9,797
2,277
2,597
17.3
18.3
149.4
172.0
28.5
24.7
4.7
3.8
25.1
28.8
4.0
3.2
Stock Watch
December 23, 2016
Company Name
Reco
CMP
Target
Mkt Cap
Sales ( Čcr )
OPM(%)
EPS (Č)
PER(x)
P/BV(x)
RoE(%)
EV/Sales(x)
(Č)
Price ( Č)
( Č cr )
FY17E FY18E
FY17E
FY18E
FY17E
FY18E
FY17E
FY18E
FY17E
FY18E
FY17E
FY18E
FY17E
FY18E
Pharmaceuticals
Cadila Healthcare
Accumulate
356
400
36,440
10,429
12,318
22.6
22.0
16.9
19.2
21.1
18.5
5.4
4.3
28.5
25.7
3.5
2.9
Cipla
Reduce
560
490
45,055
15,378
18,089
17.4
18.4
21.6
27.2
25.9
20.6
3.4
2.9
13.7
15.2
3.1
2.6
Dr Reddy's
Neutral
3,018
-
49,990
16,043
18,119
20.8
22.4
112.4
142.9
26.9
21.1
3.6
3.1
14.1
15.9
3.1
2.7
Dishman Pharma
Neutral
214
-
3,448
1,718
1,890
22.7
22.8
9.5
11.3
22.5
18.9
2.2
2.0
10.1
10.9
2.5
2.2
GSK Pharma*
Neutral
2,707
-
22,925
3,000
3,312
15.4
20.6
46.5
60.8
58.2
44.5
14.0
13.9
26.3
30.6
7.4
6.7
Indoco Remedies
Reduce
260
240
2,393
1,112
1,289
16.2
18.2
11.6
16.0
22.4
16.2
3.6
3.0
17.0
20.1
2.3
1.9
Ipca labs
Accumulate
541
613
6,829
3,303
3,799
15.3
15.3
17.3
19.7
31.3
27.5
2.7
2.5
9.1
9.4
2.2
1.9
Lupin
Buy
1,449
1,809
65,390
15,912
18,644
26.4
26.7
58.1
69.3
24.9
20.9
4.9
4.0
21.4
20.9
4.2
3.4
Sun Pharma
Buy
609
847
146,160
31,129
35,258
32.0
32.9
30.2
35.3
20.2
17.3
3.3
2.7
20.0
20.1
4.3
3.6
Power
Tata Power
Neutral
75
-
20,217
36,916
39,557
17.4
27.1
5.1
6.3
14.7
11.9
1.3
1.2
9.0
10.3
1.6
1.4
NTPC
Neutral
160
-
132,216
86,605
95,545
17.5
20.8
11.8
13.4
13.6
12.0
1.4
1.3
10.5
11.1
2.9
2.9
Power Grid
Buy
182
223
95,163
25,315
29,193
88.2
88.7
14.2
17.2
12.9
10.6
2.0
1.7
15.2
16.1
8.4
7.6
Real Estate
MLIFE
Buy
347
522
1,424
1,152
1,300
22.7
24.6
29.9
35.8
11.6
9.7
0.9
0.8
7.6
8.6
2.0
1.6
Telecom
Bharti Airtel
Neutral
293
-
117,184
105,086
114,808
34.5
34.7
12.2
16.4
24.0
17.9
1.6
1.5
6.8
8.4
2.0
1.8
Idea Cellular
Neutral
72
-
25,749
40,133
43,731
37.2
37.1
6.4
6.5
11.2
11.0
0.9
0.9
8.2
7.6
1.7
1.4
zOthers
Abbott India
Neutral
4,579
-
9,729
3,153
3,583
14.1
14.4
152.2
182.7
30.1
25.1
147.7
126.1
25.6
26.1
2.8
2.4
Bajaj Electricals
Buy
215
274
2,176
4,801
5,351
5.7
6.2
10.4
13.7
20.6
15.7
2.6
2.3
12.4
14.5
0.5
0.4
Finolex Cables
Neutral
409
-
6,249
2,883
3,115
12.0
12.1
14.2
18.6
28.8
22.0
15.3
13.4
15.8
14.6
1.9
1.7
Goodyear India*
Neutral
672
-
1,550
1,598
1,704
10.4
10.2
49.4
52.6
13.6
12.8
62.8
55.1
18.2
17.0
0.7
90.0
Hitachi
Neutral
1,405
-
3,820
2,081
2,433
8.8
8.9
33.4
39.9
42.1
35.2
33.9
28.3
22.1
21.4
1.8
1.5
Jyothy Laboratories
Neutral
337
-
6,123
1,440
2,052
11.5
13.0
8.5
10.0
39.7
33.7
9.6
8.9
18.6
19.3
4.5
3.2
Page Industries
Neutral
13,402
-
14,948
2,450
3,124
20.1
17.6
299.0
310.0
44.8
43.2
298.5
227.9
47.1
87.5
6.2
4.8
Relaxo Footwears
Neutral
399
-
4,788
2,085
2,469
9.2
8.2
7.6
8.0
52.7
50.2
20.4
17.5
17.9
18.8
2.4
2.0
Siyaram Silk Mills
Accumulate
1,188
1,605
1,113
1,733
1,948
11.6
11.7
96.6
114.7
12.3
10.4
1.9
1.6
15.3
15.7
0.8
0.7
Styrolution ABS India*
Neutral
582
-
1,023
1,440
1,537
9.2
9.0
40.6
42.6
14.3
13.7
36.6
33.3
12.3
11.6
0.7
0.6
TVS Srichakra
Neutral
3,197
-
2,448
2,304
2,614
13.7
13.8
231.1
266.6
13.8
12.0
359.3
282.9
33.9
29.3
1.1
0.9
HSIL
Neutral
279
-
2,015
2,384
2,515
15.8
16.3
15.3
19.4
18.2
14.4
18.1
15.6
7.8
9.3
1.0
0.9
Kirloskar Engines India
Neutral
322
-
4,657
2,554
2,800
9.9
10.0
10.5
12.1
30.7
26.6
12.8
12.1
10.7
11.7
1.5
1.3
Ltd
M M Forgings
Neutral
434
-
524
546
608
20.4
20.7
41.3
48.7
10.5
8.9
59.4
52.6
16.6
17.0
0.8
0.7
Stock Watch
December 23, 2016
Company Name
Reco
CMP
Target
Mkt Cap
Sales ( Čcr )
OPM(%)
EPS (Č)
PER(x)
P/BV(x)
RoE(%)
EV/Sales(x)
(Č)
Price ( Č)
( Č cr )
FY17E
FY18E
FY17E
FY18E
FY17E
FY18E
FY17E
FY18E
FY17E
FY18E
FY17E
FY18E
FY17E
FY18E
zOthers
Banco Products (India) Neutral
177
-
1,265
1,353
1,471
12.3
12.4
14.5
16.3
12.2
10.9
16.9
15.2
14.5
14.6
0.9
93.5
Competent Automobiles Neutral
160
-
98
1,137
1,256
3.1
2.7
28.0
23.6
5.7
6.8
30.8
27.8
14.3
11.5
0.1
0.1
Nilkamal
Neutral
1,278
-
1,906
1,995
2,165
10.7
10.4
69.8
80.6
18.3
15.9
73.0
63.4
16.6
16.5
1.0
0.8
Visaka Industries
Neutral
176
-
279
1,051
1,138
10.3
10.4
21.0
23.1
8.4
7.6
22.5
21.1
9.0
9.2
0.5
0.5
Transport Corporation of
Neutral
150
-
1,151
2,671
2,911
8.5
8.8
13.9
15.7
10.8
9.6
1.5
1.3
13.7
13.8
0.5
0.5
India
Elecon Engineering
Neutral
56
-
631
1,482
1,660
13.7
14.5
3.9
5.8
14.4
9.7
3.4
3.1
7.8
10.9
0.7
0.7
Surya Roshni
Neutral
174
-
761
3,342
3,625
7.8
7.5
17.3
19.8
10.1
8.8
19.1
15.3
10.5
10.8
0.5
0.4
MT Educare
Neutral
111
-
441
366
417
17.7
18.2
9.4
10.8
11.8
10.3
2.6
2.3
22.2
22.3
1.1
1.0
Radico Khaitan
Buy
108
147
1,441
1,667
1,824
13.0
13.2
6.7
8.2
16.3
13.2
1.5
1.4
9.0
10.2
1.3
1.1
Garware Wall Ropes
Neutral
631
-
1,381
873
938
14.3
14.3
35.2
37.5
18.0
16.8
3.1
2.7
17.5
15.9
1.5
1.4
Wonderla Holidays
Neutral
342
-
1,934
287
355
38.0
40.0
11.3
14.2
30.3
24.1
4.3
3.8
21.4
23.9
6.4
5.2
Linc Pen & Plastics
Neutral
228
-
337
382
420
9.3
9.5
13.5
15.7
16.9
14.5
2.9
2.5
17.1
17.3
0.9
0.8
The Byke Hospitality
Neutral
166
-
667
287
384
20.5
20.5
7.6
10.7
21.9
15.5
4.6
3.7
20.7
23.5
2.3
1.7
Interglobe Aviation
Neutral
828
-
29,939
21,122
26,005
14.5
27.6
110.7
132.1
7.5
6.3
44.8
32.0
168.5
201.1
1.4
1.1
Coffee Day Enterprises
Neutral
196
-
4,041
2,964
3,260
20.5
21.2
4.7
8.0
-
24.5
2.3
2.1
5.5
8.5
1.8
1.6
Ltd
Navneet Education
Neutral
110
-
2,616
1,062
1,147
24.0
24.0
6.1
6.6
18.0
16.6
3.7
3.3
20.6
19.8
2.5
2.4
Navkar Corporation
Buy
164
265
2,336
369
561
42.9
42.3
7.2
11.5
22.7
14.2
1.7
1.5
7.4
10.5
7.3
4.8
UFO Moviez
Neutral
410
-
1,131
619
685
33.2
33.4
30.0
34.9
13.7
11.7
1.9
1.6
13.8
13.9
1.5
1.2
VRL Logistics
Neutral
262
-
2,387
1,902
2,119
16.7
16.6
14.6
16.8
18.0
15.6
3.9
3.5
21.9
22.2
1.4
1.2
Team Lease Serv.
Neutral
882
-
1,508
3,229
4,001
1.5
1.8
22.8
32.8
38.7
26.9
4.2
3.6
10.7
13.4
0.4
0.3
S H Kelkar & Co.
Neutral
286
-
4,138
1,036
1,160
15.1
15.0
6.1
7.2
46.9
39.9
5.0
4.6
10.7
11.5
3.9
3.4
Quick Heal
Neutral
254
-
1,782
408
495
27.3
27.0
7.7
8.8
32.9
28.9
3.1
3.1
9.3
10.6
3.5
2.9
Narayana Hrudaya
Neutral
338
-
6,907
1,873
2,166
11.5
11.7
2.6
4.0
127.8
85.3
7.8
7.1
6.1
8.3
3.8
3.3
Manpasand Bever.
Neutral
545
-
3,115
836
1,087
19.6
19.4
16.9
23.8
32.2
22.9
3.9
3.4
12.0
14.8
3.5
2.6
Parag Milk Foods
Neutral
258
-
2,174
1,919
2,231
9.3
9.6
9.5
12.9
27.4
20.0
4.3
3.5
15.5
17.5
1.3
1.1
Mirza International
Buy
84
107
1,005
987
1,106
18.0
18.0
6.5
7.6
12.8
11.0
2.1
1.8
15.9
15.7
1.2
1.1
Asian Granito
Buy
220
351
662
1,071
1,182
12.1
12.4
12.7
16.0
17.3
13.8
1.7
1.5
9.5
10.7
0.9
0.8
Source: Company, Angel Research; Note: *December year end; #September year end; &October year end; Price as on December 22, 2016
Market Outlook
December 23, 2016
Research Team Tel: 022 - 39357800
DISCLAIMER
Angel Broking Private Limited (hereinafter referred to as “Angel”) is a registered Member of National Stock Exchange of India
Limited,Bombay Stock Exchange Limited and Metropolitan Stock Exchange Limited. It is also registered as a Depository Participant with
CDSL and Portfolio Manager with SEBI. It also has registration with AMFI as a Mutual Fund Distributor. Angel Broking Private Limited is a
registered entity with SEBI for Research Analyst in terms of SEBI (Research Analyst) Regulations, 2014 vide registration number
INH000000164. Angel or its associates has not been debarred/ suspended by SEBI or any other regulatory authority for accessing
/dealing in securities Market. Angel or its associates/analyst has not received any compensation / managed or
co-managed public offering of securities of the company covered by Analyst during the past twelve months.
This document is solely for the personal information of the recipient, and must not be singularly used as the basis of any investment
decision. Nothing in this document should be construed as investment or financial advice. Each recipient of this document should make
such investigations as they deem necessary to arrive at an independent evaluation of an investment in the securities of the companies
referred to in this document (including the merits and risks involved), and should consult their own advisors to determine the merits and
risks of such an investment.
Reports based on technical and derivative analysis center on studying charts of a stock's price movement, outstanding positions and
trading volume, as opposed to focusing on a company's fundamentals and, as such, may not match with a report on a company's
fundamentals. Investors are advised to refer the Fundamental and Technical Research Reports available on our website to evaluate the
contrary view, if any.
The information in this document has been printed on the basis of publicly available information, internal data and other reliable
sources believed to be true, but we do not represent that it is accurate or complete and it should not be relied on as such, as this
document is for general guidance only. Angel Broking Pvt. Limited or any of its affiliates/ group companies shall not be in any way
responsible for any loss or damage that may arise to any person from any inadvertent error in the information contained in this report.
Angel Broking Pvt. Limited has not independently verified all the information contained within this document. Accordingly, we cannot
testify, nor make any representation or warranty, express or implied, to the accuracy, contents or data contained within this document.
While Angel Broking Pvt. Limited endeavors to update on a reasonable basis the information discussed in this material, there may be
regulatory, compliance, or other reasons that prevent us from doing so.
This document is being supplied to you solely for your information, and its contents, information or data may not be reproduced,
redistributed or passed on, directly or indirectly.
Neither Angel Broking Pvt. Limited, nor its directors, employees or affiliates shall be liable for any loss or damage that may arise from
or in connection with the use of this information.